[DEVIATION ANALYSIS]
Deviation Analysis is one of the most powerful applications of laser scanning.
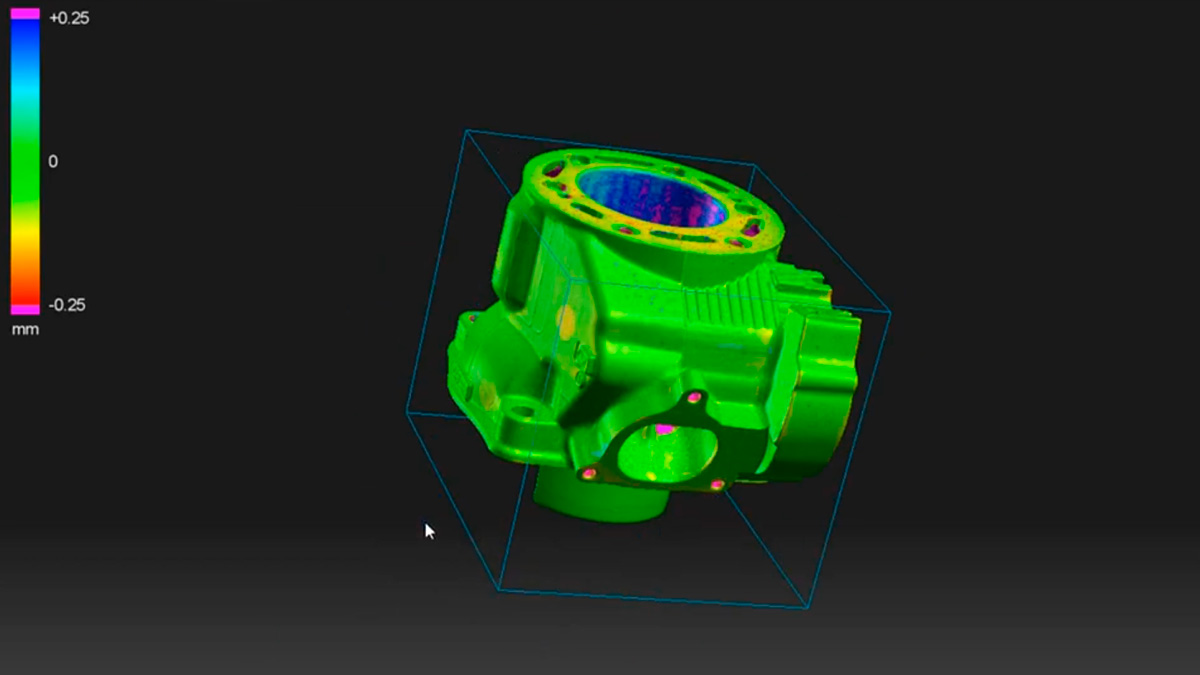
Deviation analysis is the process of comparing the captured 3D scan data (the “as-built” condition) against a reference model or design drawing (the “as-designed” intent) to identify differences.
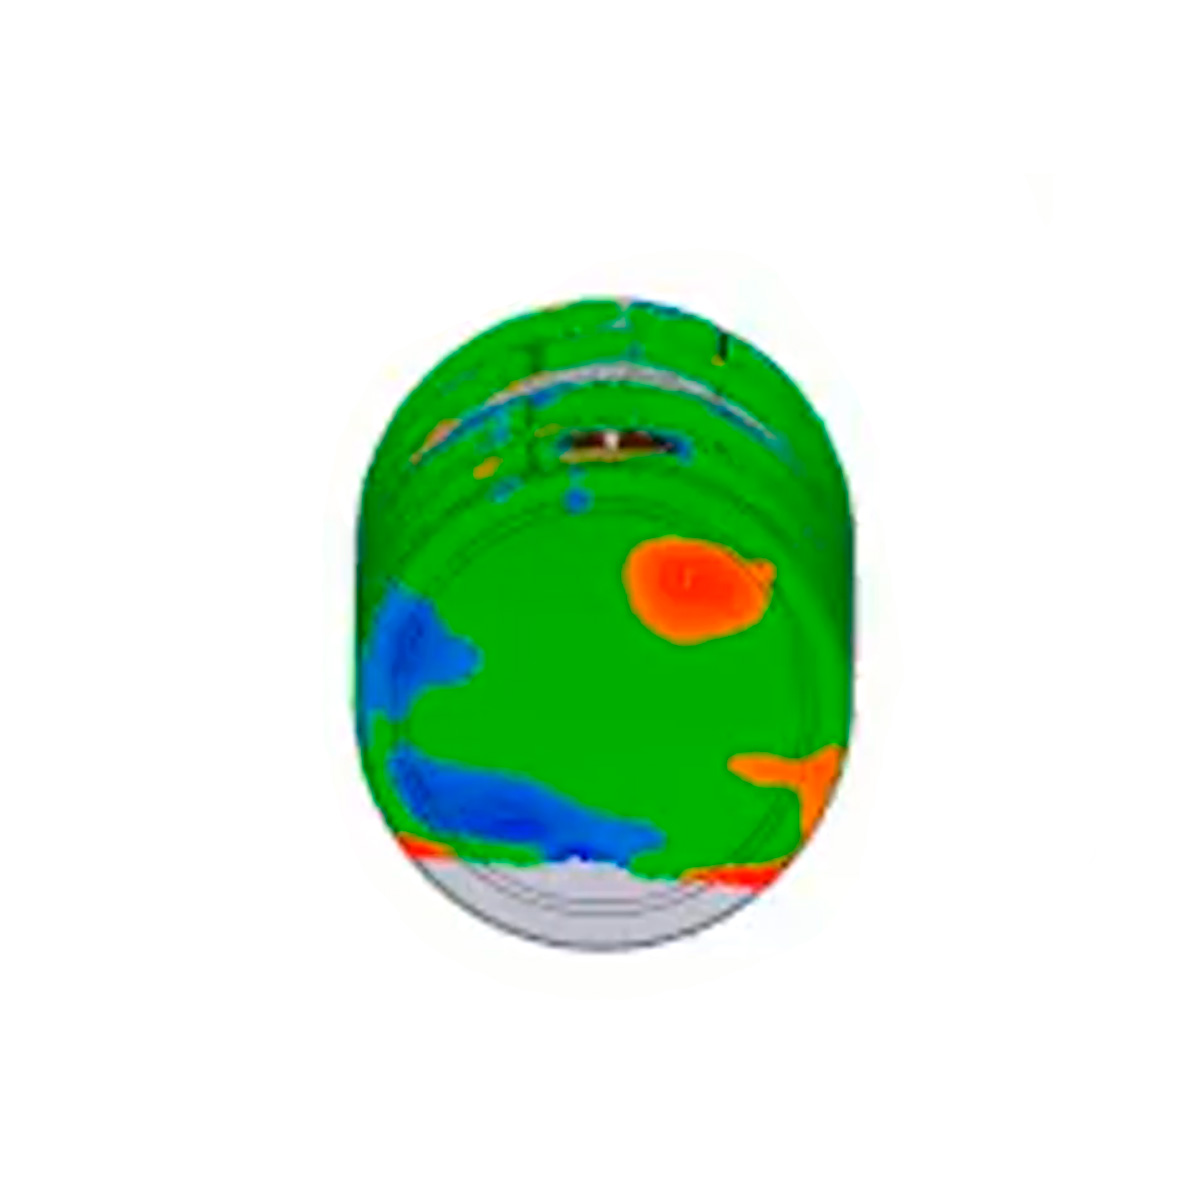
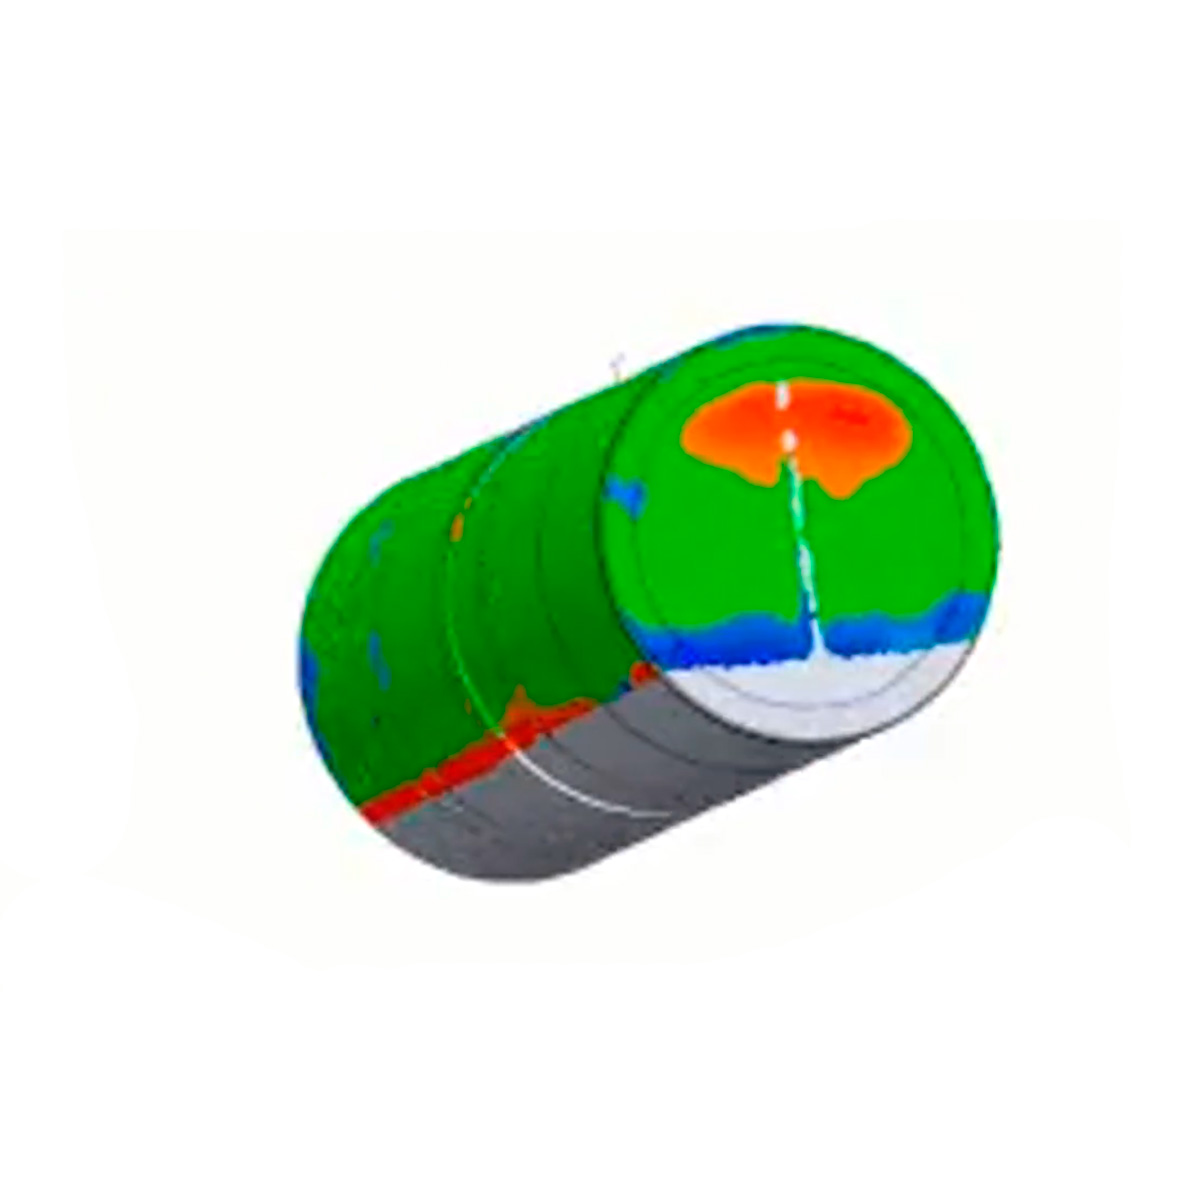
The result is usually shown as a color-coded heatmap, where deviations from the design are displayed in different colors based on tolerance thresholds (e.g., green = within tolerance, red/blue = out of tolerance).
The result is usually shown as a color-coded heatmap, where deviations from the design are displayed in different colors based on tolerance thresholds (e.g., green = within tolerance, red/blue = out of tolerance).